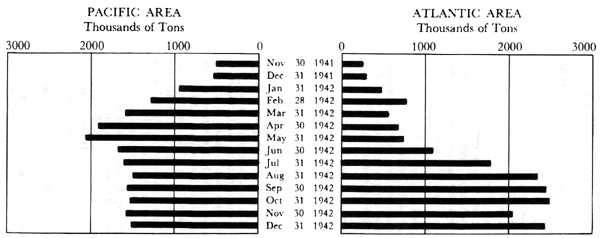
|
Total DWT |
|
Total DWT |
Grand Total DWT |
|||
|---|---|---|---|---|---|---|---|
| Troop-ships DWT |
Cargo Ships DWT |
Troop-ships DWT |
Cargo Ships DWT |
||||
| Nov 30 1941 |
222,963
|
306,201
|
529,164
|
78,561
|
170,789
|
249,350
|
778,514
|
| Dec 31 |
247,233
|
328,885
|
576,118
|
120,403
|
174,847
|
295,250
|
871,368
|
| Jan 31 1942 |
493,320
|
460,226
|
953,546
|
216,639
|
259,337
|
475,976
|
1,429,522
|
| Feb 28 |
345,546
|
949,373
|
1,294,919
|
380,697
|
384,894
|
765,591
|
2,060,510
|
| Mar 31 |
502,417
|
1,087,223
|
1,589,640
|
228,214
|
327,951
|
556,165;
|
2,145,805
|
| Apr 30 |
1,610,283
|
1,281,190
|
1,891,473
|
164,640
|
513,136
|
677,776
|
2,569,249
|
| May 31 |
&596,145
|
1,435,316
|
2.031,461
|
135,109
|
583,089
|
718,198
|
2,749,659
|
| Jun 30 |
433, 203
|
1, 230, 926
|
1, 664, 129
|
216, 032
|
880, 169
|
1, 096, 201
|
2,760, 330
|
| Jul 31 |
319, 507
|
1, 268, 492
|
1, 587, 999
|
320, 543
|
1, 495, 196
|
1, 815. 739
|
3, 403, 738
|
| Aug 31 |
329, 320
|
1, 140, 141
|
1, 469, 461
|
323, 096
|
2.002, 458
|
2, 325. 554
|
3, 795, 015
|
| Sep 30 |
360, 993
|
1, 204, 743
|
1, 565, 736
|
327, 554
|
2, 098, 325
|
2, 425, 879
|
3, 991, 615
|
| Oct 31 |
362, 973
|
1, 157, 105
|
1, 520, 078
|
343, 830
|
2, 132, 293
|
2, 476, 123
|
3, 996, 201
|
| Nov 30 |
351, 658
|
1, 223, 842
|
1, 575, 500
|
287, 298
|
1, 758, 839
|
2, 046, 137
|
3, 621, 637
|
| Dec 31 |
381, 123
|
1, 139, 554
|
1, 520, 677
|
452, 163
|
1, 967, 951
|
2, 420, 114
|
3, 940, 791
|

Page created 10 January
2002